
What You Need to Know About Home Prices
Recent data from Fannie Mae reveals that nearly a quarter of individuals still anticipate a decline in home prices. If you’re among those concerned about this, here’s a breakdown of what you should consider.
Much of this apprehension likely stems from media reports and online content. However, it’s crucial to remember that negative news tends to grab attention. This means that what you’re hearing or reading might not present the complete picture but rather a sensationalized version. As noted by Jay Thompson, a Real Estate Industry Consultant:
“Housing market headlines are ubiquitous, often sensationalized with exclamation points or dire predictions for the industry. Clickbait, the practice of sensationalizing headlines and content, has plagued the internet since its inception, and housing news is no exception.”
Let’s delve into the data to provide clarity.
Home Prices Have Mostly Increased Over the Past Year
Case-Shiller regularly publishes reports on the percentage of monthly home price changes. Analyzing their data from January 2023 to the most recent figures available, the trend becomes evident:
[Graph depicting home price changes over time]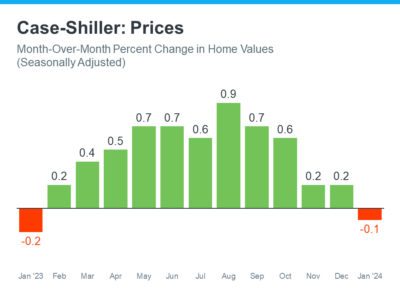
Upon observing this graph, interpretations vary depending on which color draws your attention. The green bars signify periods of home price appreciation, while the red bars denote slight declines. Media coverage often amplifies these minor downturns due to the allure of negative news. However, this can overshadow the broader narrative.
Here’s the crux of the matter: the graph predominantly showcases green bars, indicating a general increase in home prices. Even during the instances of red bars, the declines are minimal, almost negligible. In essence, when considering the entire year, home prices have exhibited an upward trajectory.
It’s customary for home price growth to decelerate during the winter months when relocation activity typically slows down. Consequently, the smaller price gains depicted by the green bars towards the end of the year align with this seasonal pattern.
To encapsulate the essence, Case Shiller, the source of the graph’s data, elaborates:
“While month-over-month numbers remained relatively flat, the annual growth was more pronounced for both indices, with increases of 7.4 percent and 6.6 percent, respectively.”
Given that expert organizations tracking home price trends reassure that these minor fluctuations are inconsequential, there’s little cause for alarm. Even Case-Shiller underscores the virtually unchanged nature of these dips and emphasizes the overall growth in home prices throughout the year.
In Conclusion
The data unequivocally demonstrates that home prices, on the whole, have appreciated over the past year. Should you have inquiries regarding home prices in your local area, consulting a trusted real estate professional is advisable.